Consumer Sentiment Volatility Structurally Higher
“We suffer more in imagination than in reality.”
-Seneca
Key Points:
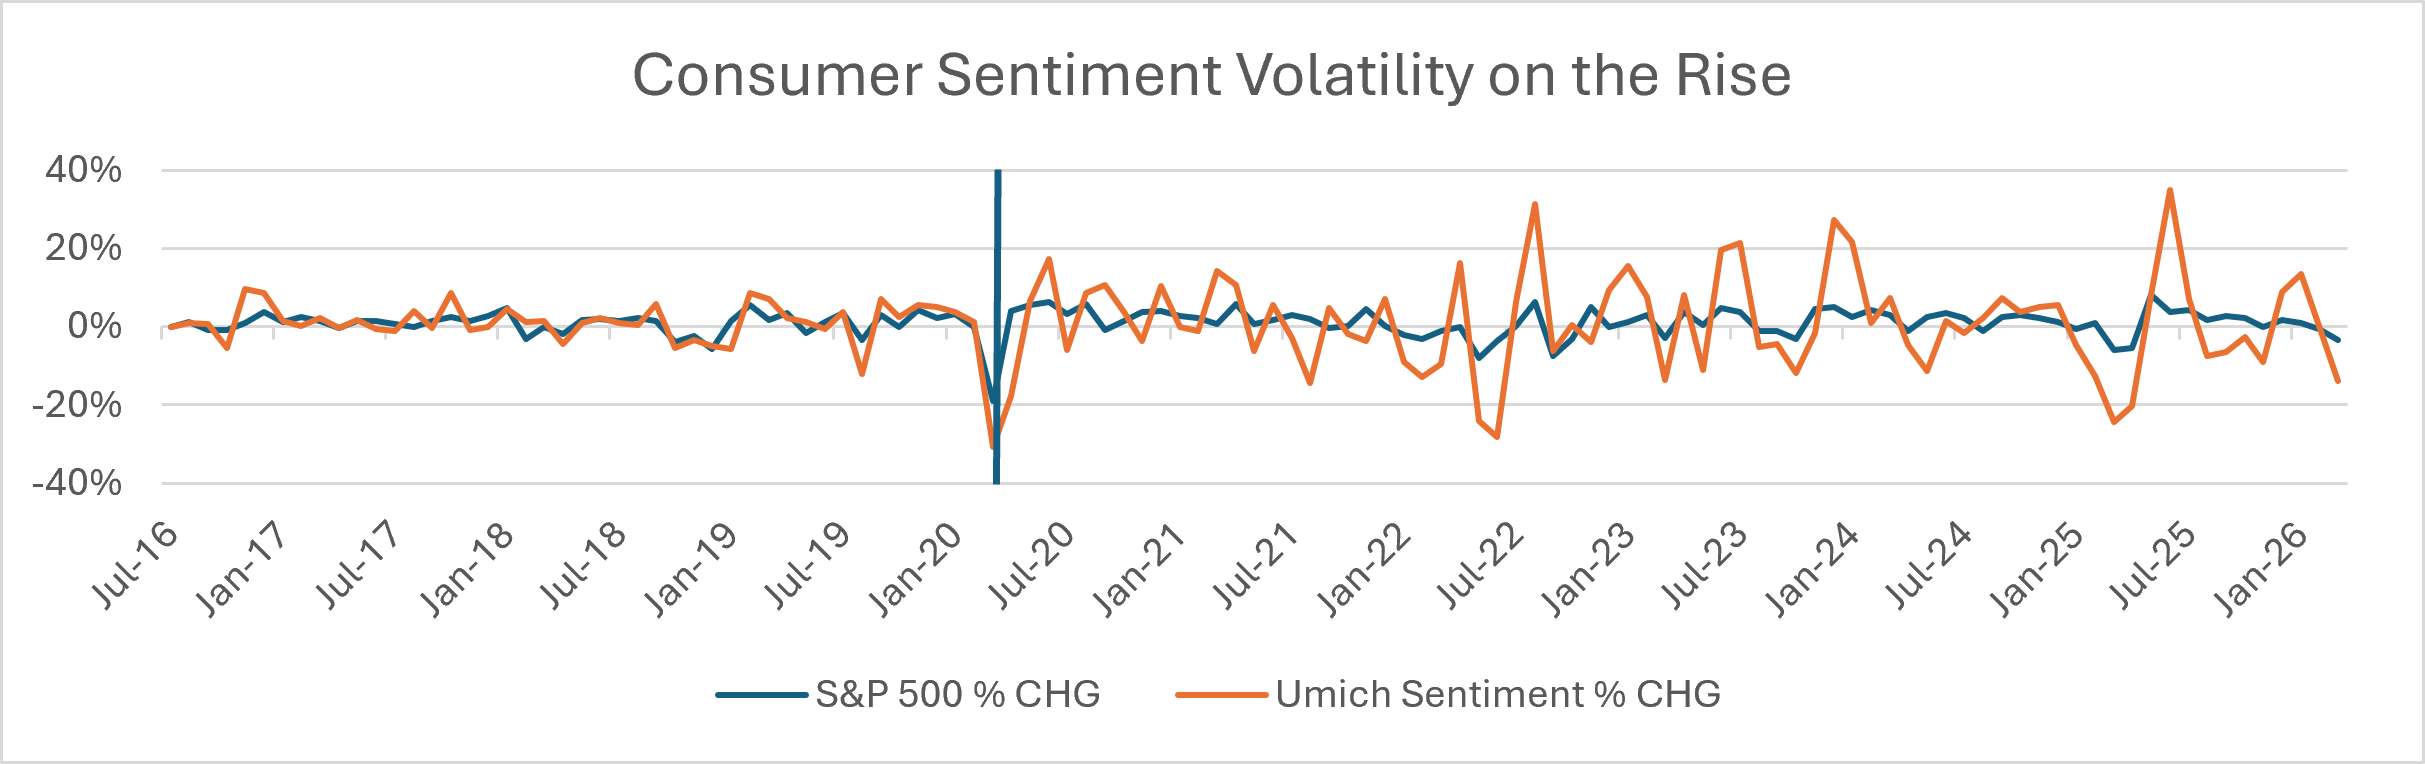
Consumer sentiment has become structurally more volatile since the March 2020 COVID shock, with monthly sentiment swings nearly doubling even as market volatility rose far less.
The relationship between consumer sentiment and the S&P 500 has weakened: consumer sentiment now explains roughly half as much variation in market returns as it did before the pandemic, despite moving in the same direction more often.
Investor sentiment remains comparatively stable and closely tied to market performance, suggesting consumers and investors may be responding to the same economy through increasingly different lenses.
Consumer sentiment and the stock market have generally moved in the same direction. As your dusty Econ 103 textbook or good old-fashioned intuition would tell you, when stocks perform well, consumers tend to feel optimistic; when markets struggle, confidence wanes. But this relationship has gotten messier after the COVID shock of March 2020.
A comparison of consumer sentiment data, S&P 500 performance, and investor sentiment reveals a marked shift that has taken place over the last six years: consumer sentiment has become significantly more volatile while becoming less connected to market performance. At the same time, investor sentiment has remained largely stable and continues to track market movements closely.
One of the clearest signs of this shift is the declining explanatory power of consumer sentiment relative to stock market performance. Comparing the four years preceding March 2020 with the six that followed, the coefficient of determination (R²) between sentiment as measured by the University of Michigan Consumer Sentiment Survey and the S&P 500 fell from 0.24 to 0.13. In layman’s terms, consumer sentiment now explains roughly half as much of the variation in market returns as it did before the pandemic. The relationship hasn't disappeared entirely, but it has noticeably deteriorated, even if the R² wasn’t exactly sky-high to begin with.
The more interesting story, as one may intuit by glancing to the left and then to the right of the vertical line on the chart above, is the dramatic increase in consumer sentiment volatility. While the standard deviation of monthly S&P 500 movements has increased by almost 30% from April of 2020 to the present, consumer sentiment volatility has nearly doubled, ripping 96% higher from a standard deviation of 3.61 to 7.08 in the last six years.
The precise causes of this heightened sensitivity are beyond the scope of this post, but they likely reflect the difficult-to-measure emotional toll of the shocks experienced over the last several years, including the pandemic, the inflation surge of 2021–22, and ongoing geopolitical uncertainty in the Middle East, Ukraine, and elsewhere. On the upside, that sensitivity may also reflect the siren songs of hyperscaler optimism, record-breaking IPOs, and consumer spending and employment data that point to resilient underlying markets. The result is a consumer that appears simultaneously more prone to both doom-and-gloom pessimism and wide-eyed exuberance than the one investors (and advisors!) had grown accustomed to prior to 2020.
Despite the weaker correlative relationship, consumer sentiment and market direction have actually become more aligned. Prior to March of 2020, consumer sentiment and the S&P 500 moved in the same direction approximately 49% of the time. Since then, that figure has risen to 58%. Therefore, both may be moving directionally together more frequently, but consumers are experiencing much larger emotional swings than the bloodless verdict of the market would find reasonable.
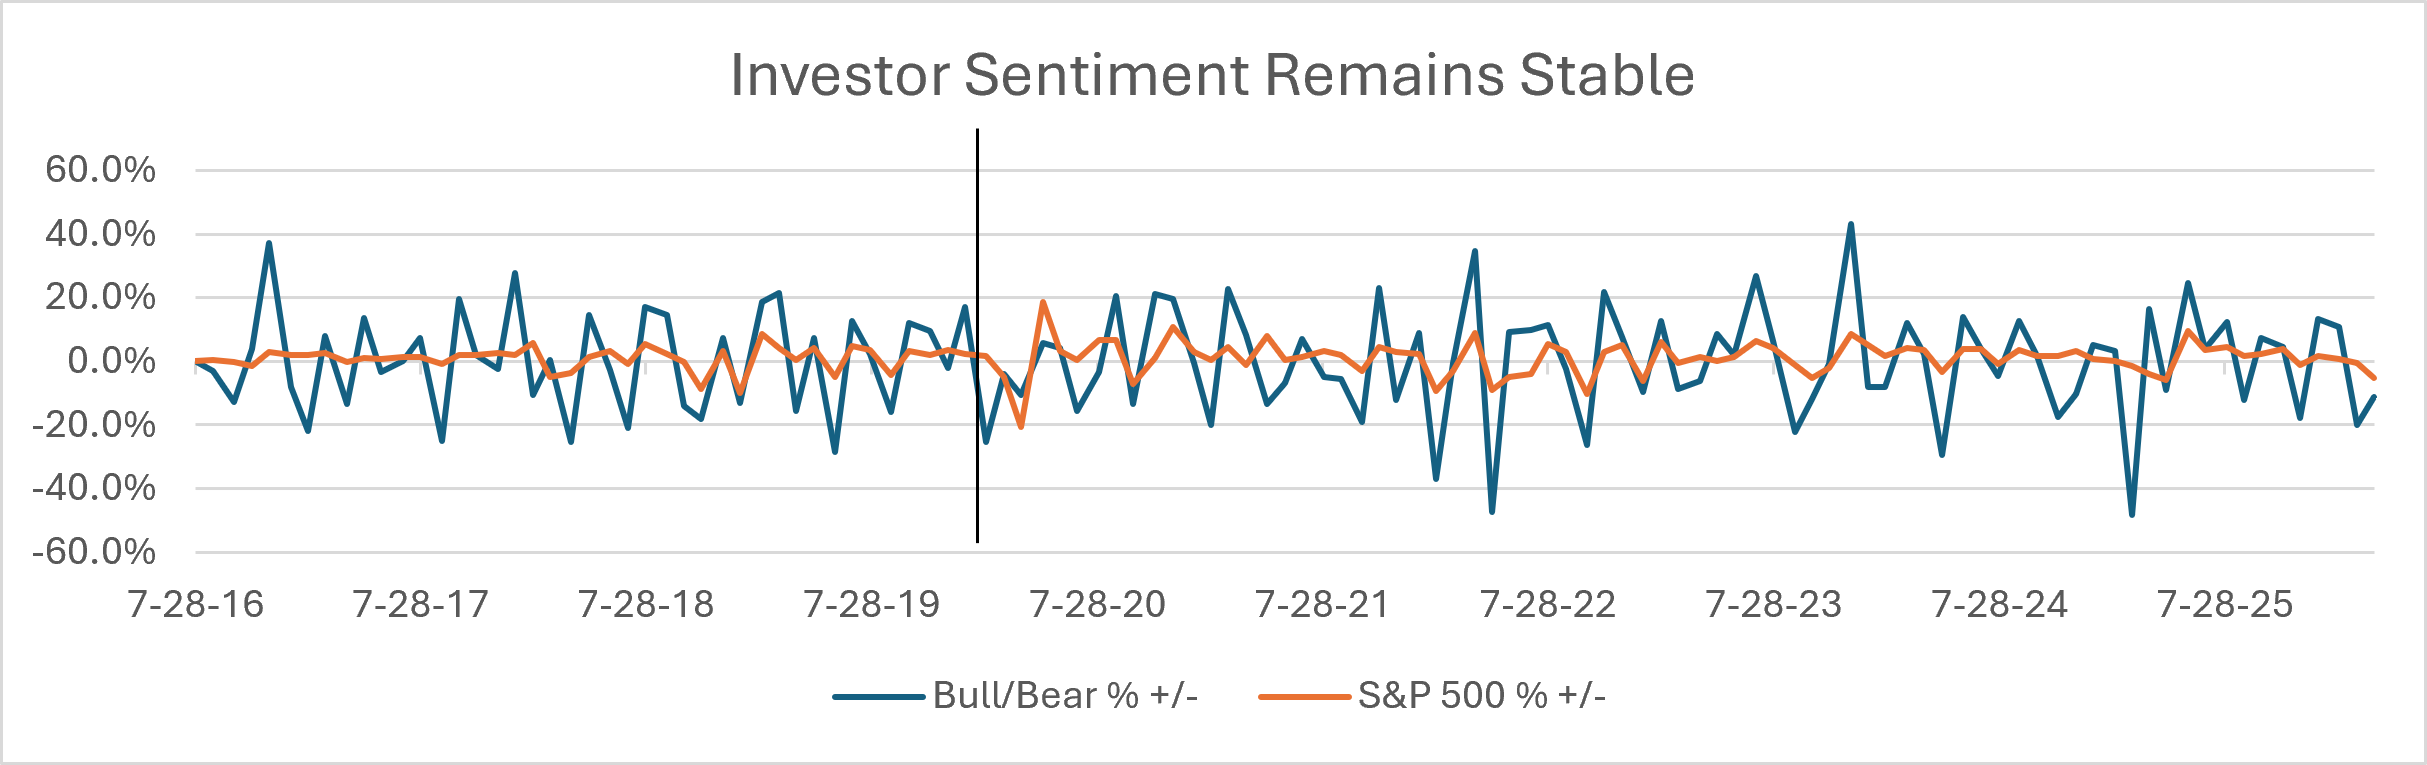
Shifting our focus to American Association of Individual Investors (AAII) sentiment data, investor sentiment volatility has decreased modestly since March 2020. The standard deviation of investor sentiment as measured by the self-reported Bull/Bear spread rose from 4.82% to 4.90%. At the same time, investor sentiment continues to move in tandem with the S&P 500 approximately 62% of the time, all but entirely unchanged from the pre-COVID period. This of course stands in sharp contrast to the increasingly swingy, disconnected consumer sentiment examined above.
Taken together, the data suggest that consumers and investors may increasingly be operating in different economic realities. Consumers have become more volatile, more reactive, and less connected to market performance than at any point in the last decade. Investors, meanwhile, have remained more consistent in how they respond to market conditions. This divergence is one of the more unique quirks of the current economic cycle, and a trend worth watching in the months and years ahead. But in the meantime, maybe the average consumer should take a beat and heed the words of our good friend Seneca.
* A brief note regarding S&P 500 performance. Keen-eyed readers may spot that across the two charts in this post; those lines are not the same. What gives! This is due to how the two sentiment data sets are reported. UMich is monthly, AAII is weekly. So the S&P 500 data depicted in the first chart are the true month end close price movements, matching the time period the survey respondents are reacting to, whereas the AAII data is matched with the last Friday’s S&P 500 closing price in that month, also more clearly illustrating the market movements those surveyed are responding to.
Disclaimer
This material is provided for informational and educational purposes only and is not intended as, and should not be construed as, investment, legal, tax, or accounting advice. The information is general in nature, does not take into account any individual’s objectives, financial situation, or needs, and should not be relied upon as a recommendation to buy, sell, or hold any security or to engage in any particular investment strategy. Nothing herein constitutes an offer to sell or a solicitation of an offer to buy any security or investment advisory services, nor is it intended to create an advisory relationship. All investing involves risk, including the possible loss of principal. Past performance is not indicative of future results, and no assurance can be given that any strategy will achieve its objectives. Any forward-looking statements, opinions, or estimates are as of the date indicated and may change without notice. Information has been obtained from sources believed to be reliable; however, accuracy and completeness are not guaranteed. If index, benchmark, or third-party information is referenced, it is provided for illustrative purposes only. You should consult with a qualified professional regarding your specific circumstances. Additional information about the adviser, including Form ADV, is available upon request.