Market Volatility and Long-Term Investing
For many investors, market downturns can feel unsettling. This can be especially true for investors who are still accumulating wealth. When markets decline because of wars, geopolitical tensions, or economic uncertainty, it is natural to ask, “Is it better to stop investing and wait for things to improve, or to keep investing even when markets are down?”
Many investors assume that strong, steadily rising markets are the best environment for long‑term growth. At the same time, downturns are often viewed as setbacks to be avoided. But for investors who are consistently contributing to their portfolios, the optimal price path might be surprising. To explore this idea, we looked at how different market paths can affect long‑term outcomes.
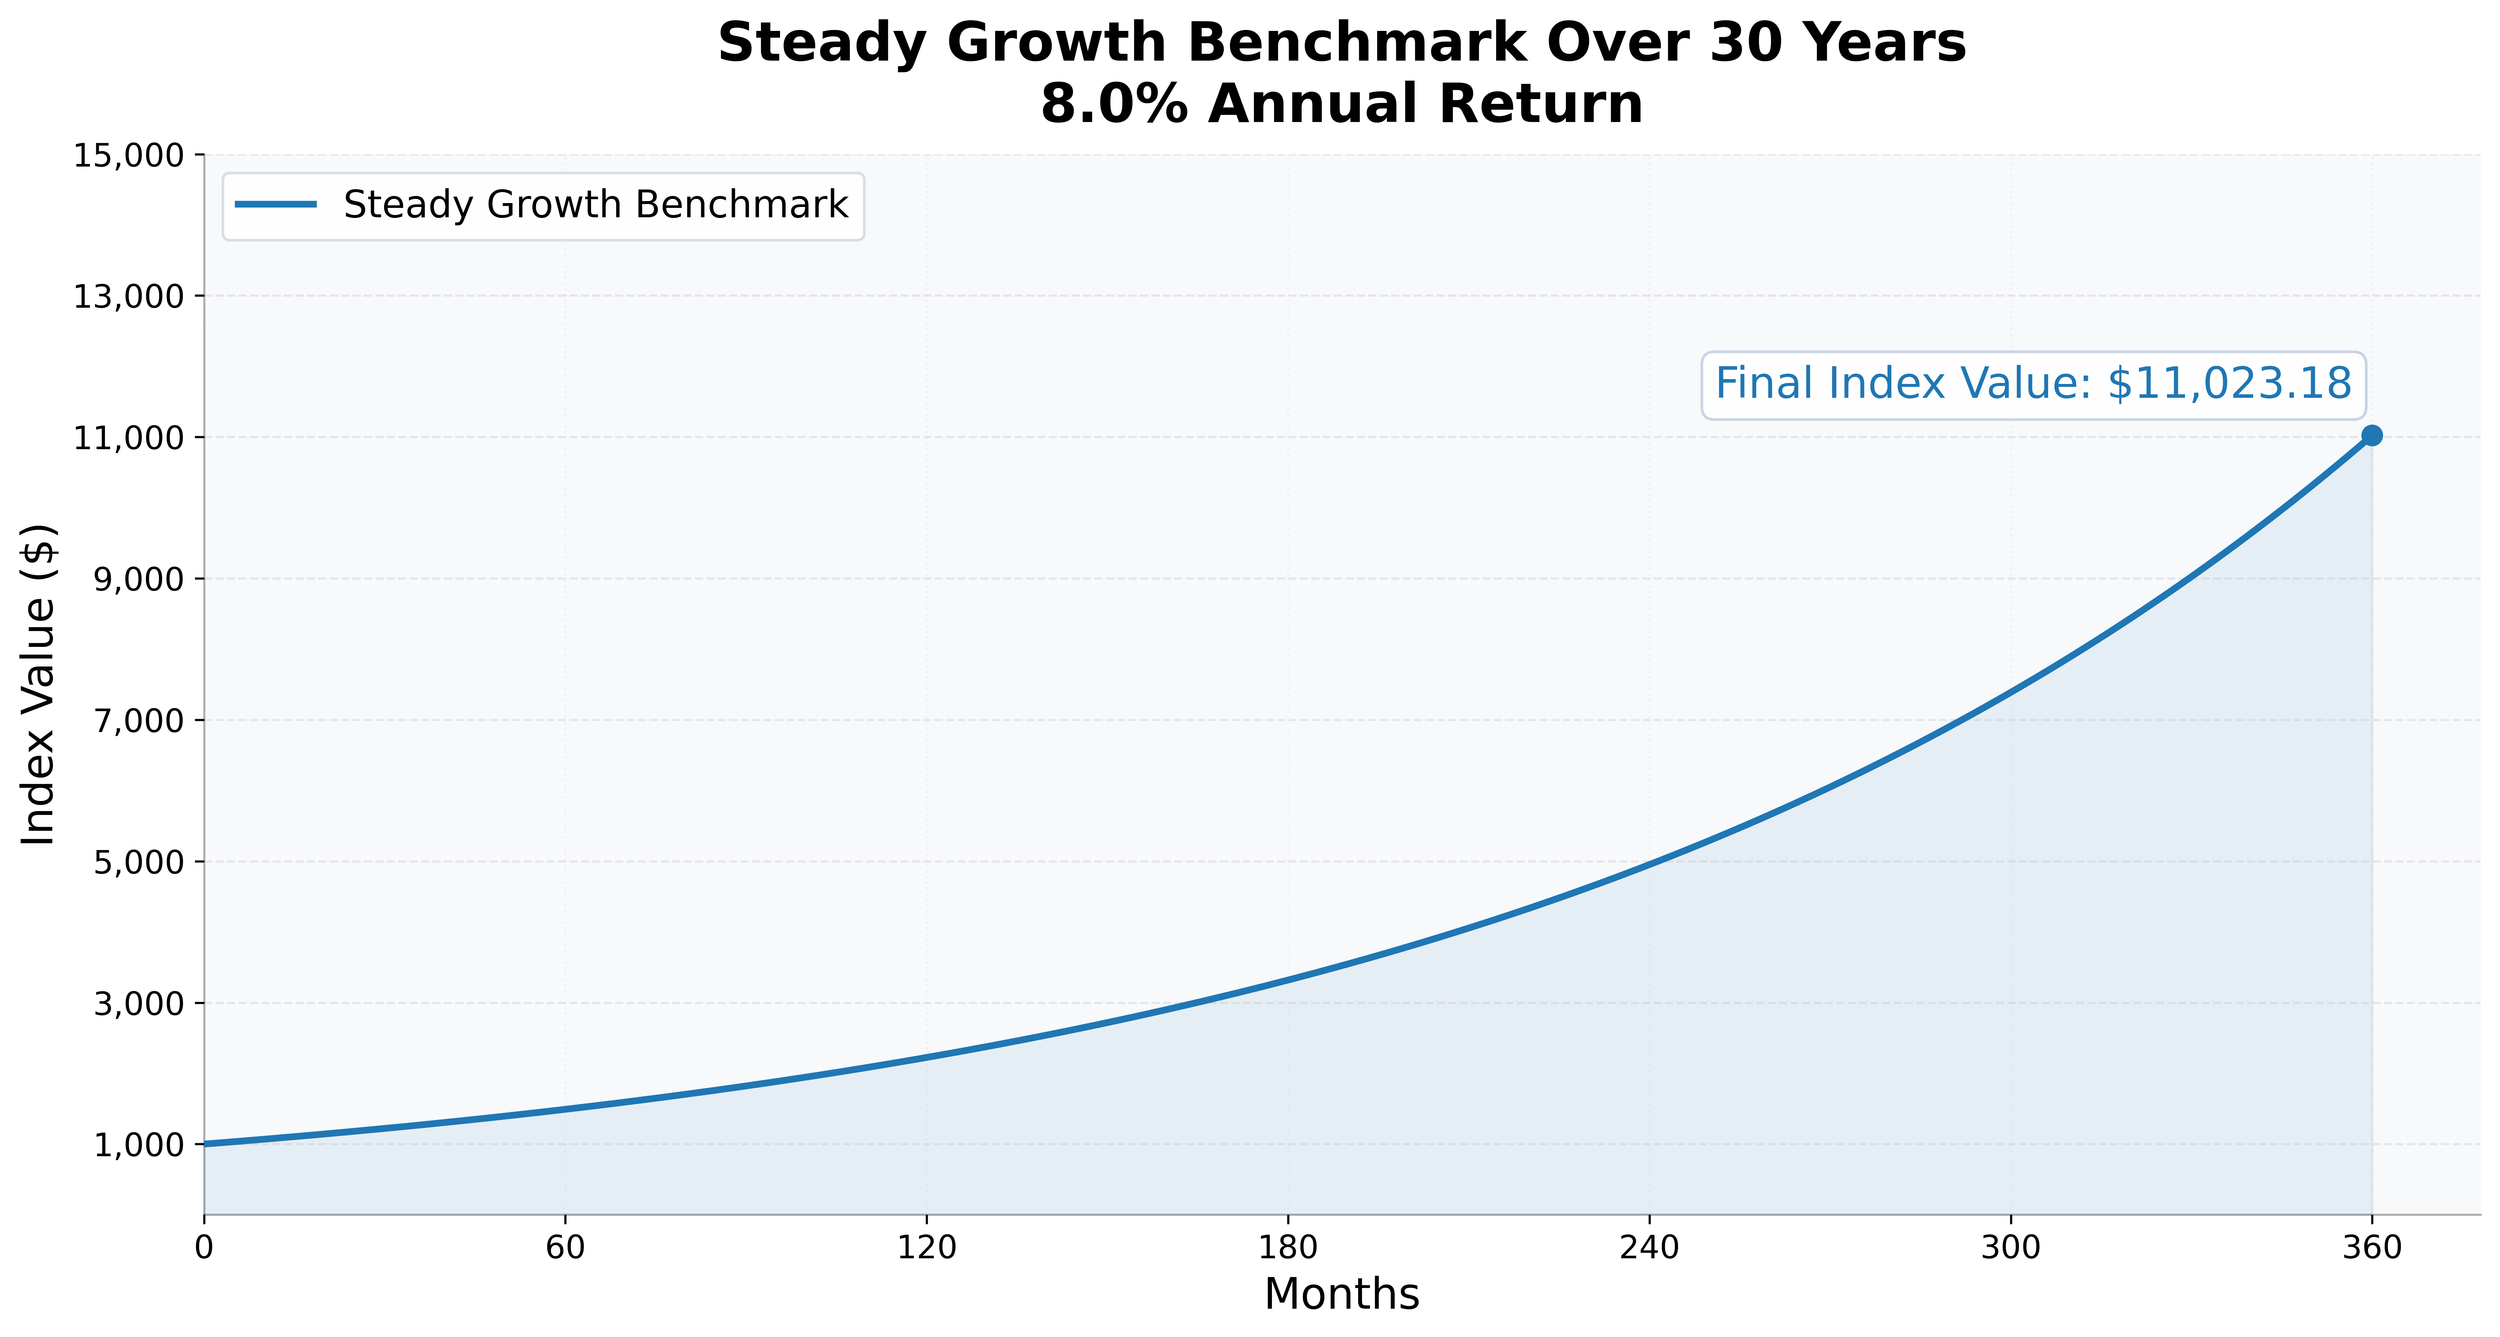
We start by defining the simplest benchmark we can, an “index” that grows at a set annualized rate of return with zero volatility. The starting value of the index is $1,000 and we let the index grow for 30 years (360 months) at an annual 8% rate of return. If an investor were to invest $1,800 into this index each month, the investor would end with a final value of $2,715,288.50.
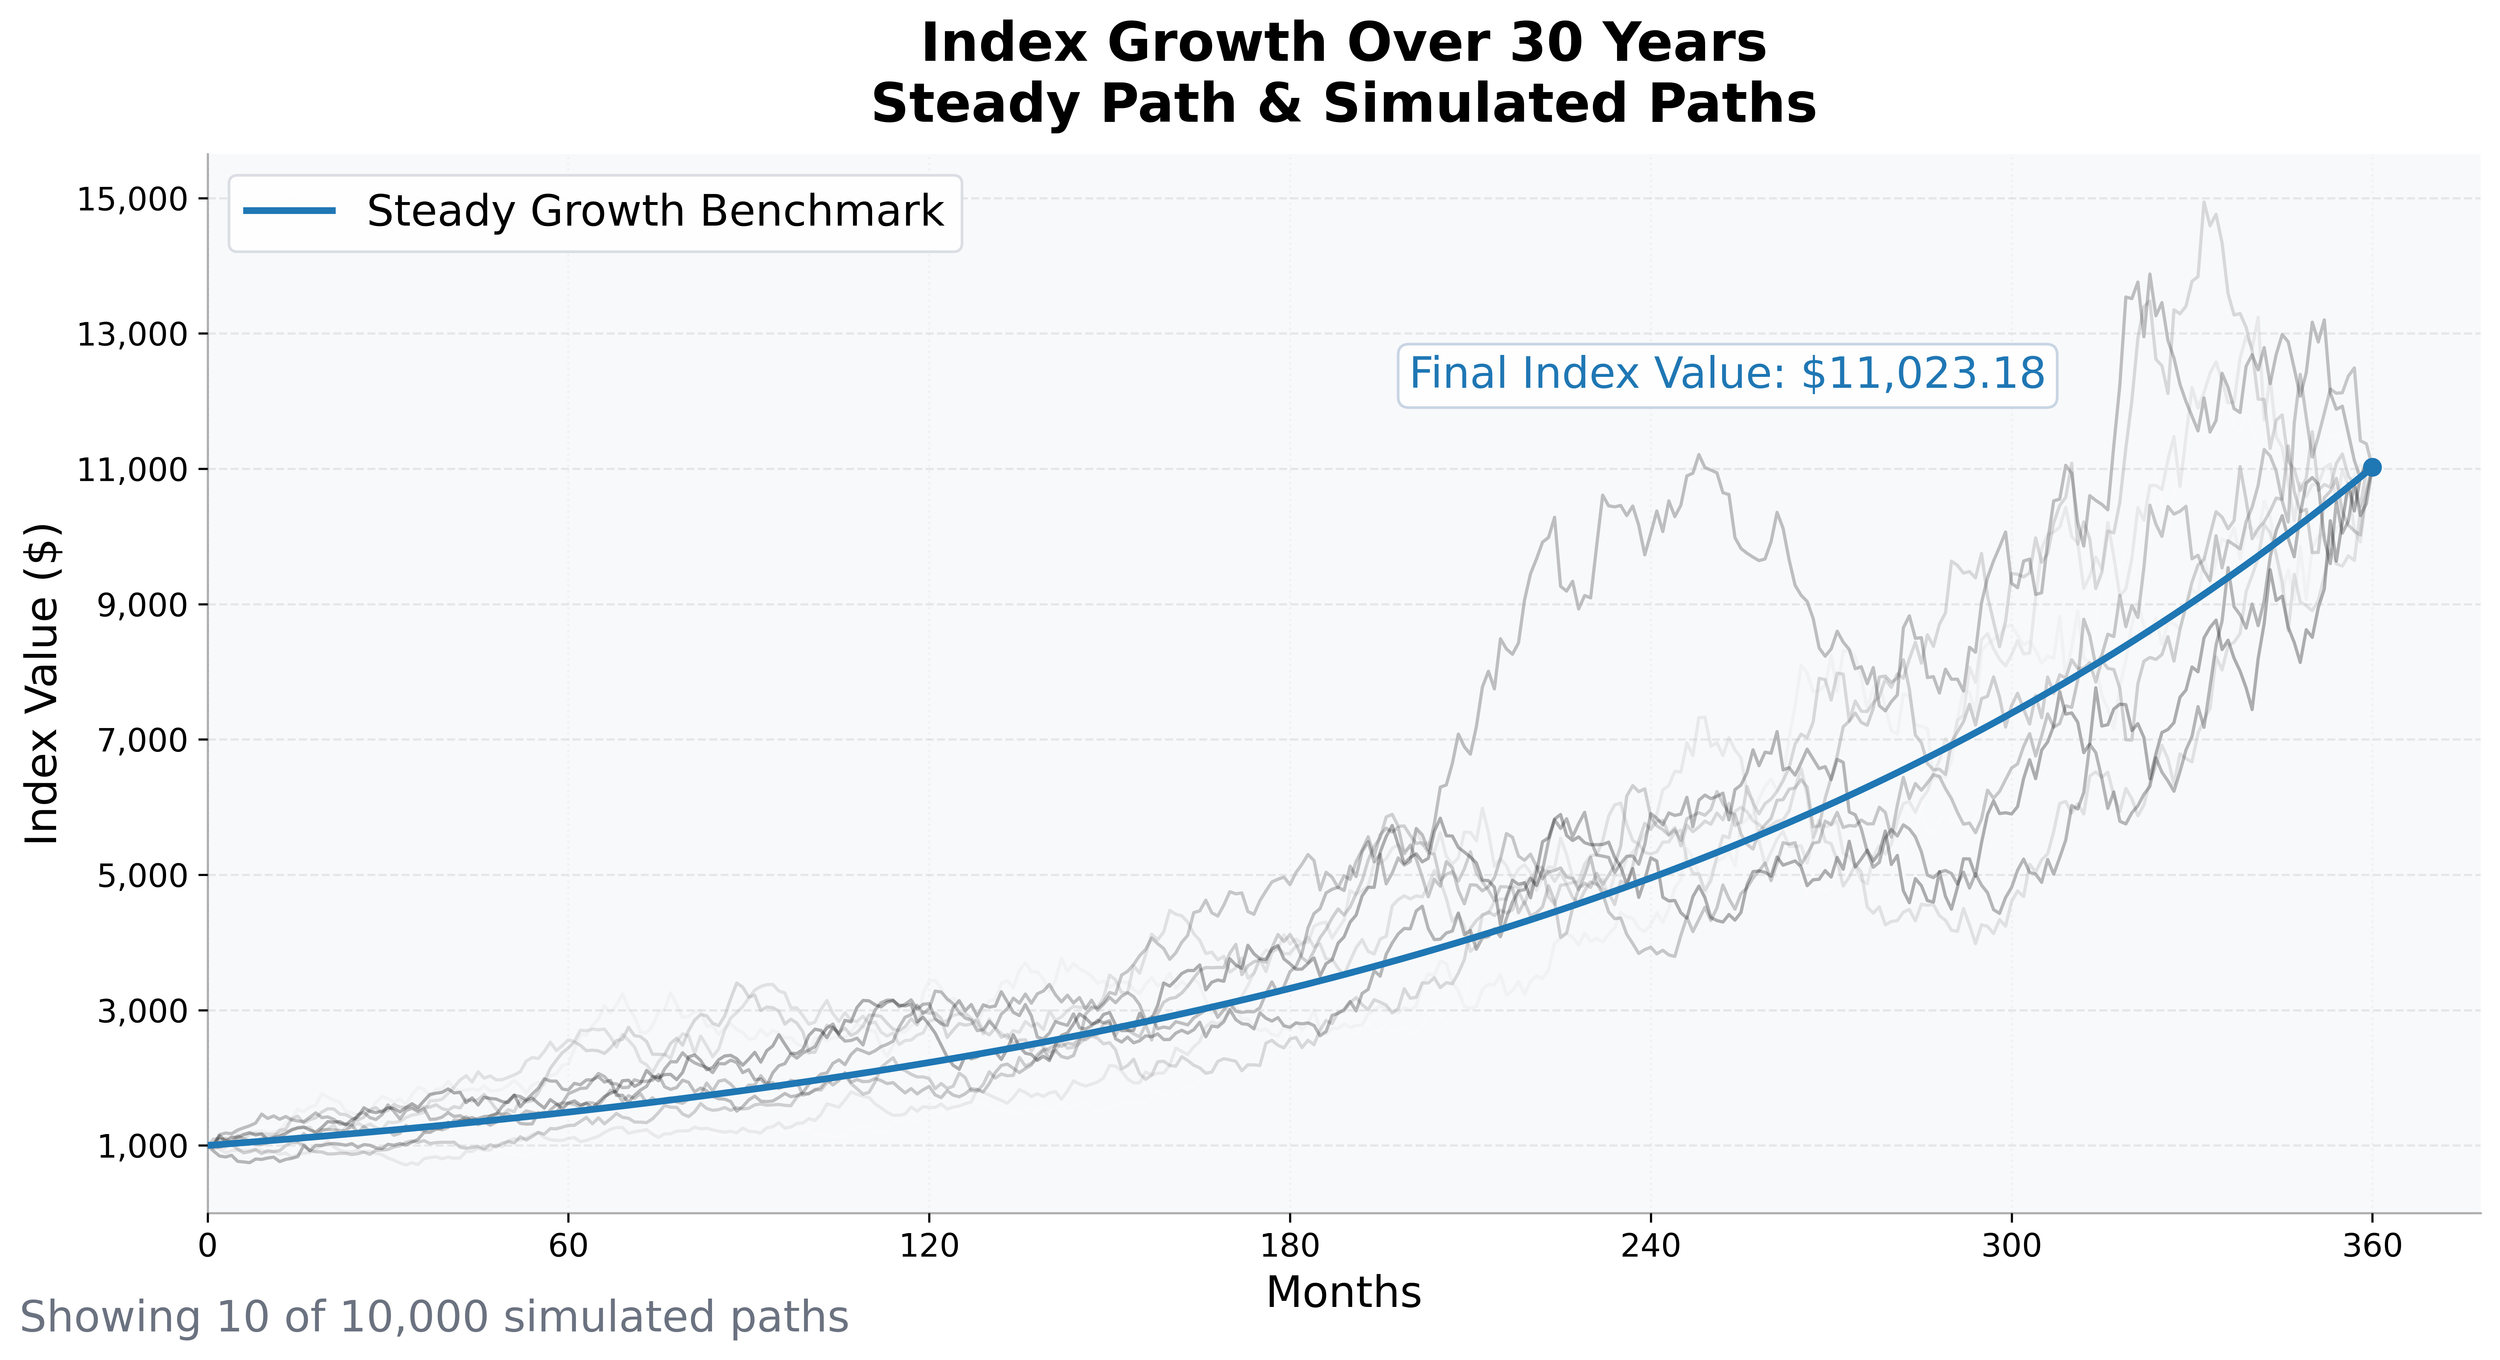
From here we need to create a set of alternative indices that we can test against the benchmark in terms of investment outcome. We will use Monte Carlo simulation to explore these different possible paths. For the simulation, we assume the same rate of return as the benchmark (8%) and an annual standard deviation of returns of 15%. We also assume that each independent index path starts and ends at the same values at the benchmark. This allows us to compare the effect of different index price paths on the final account value.
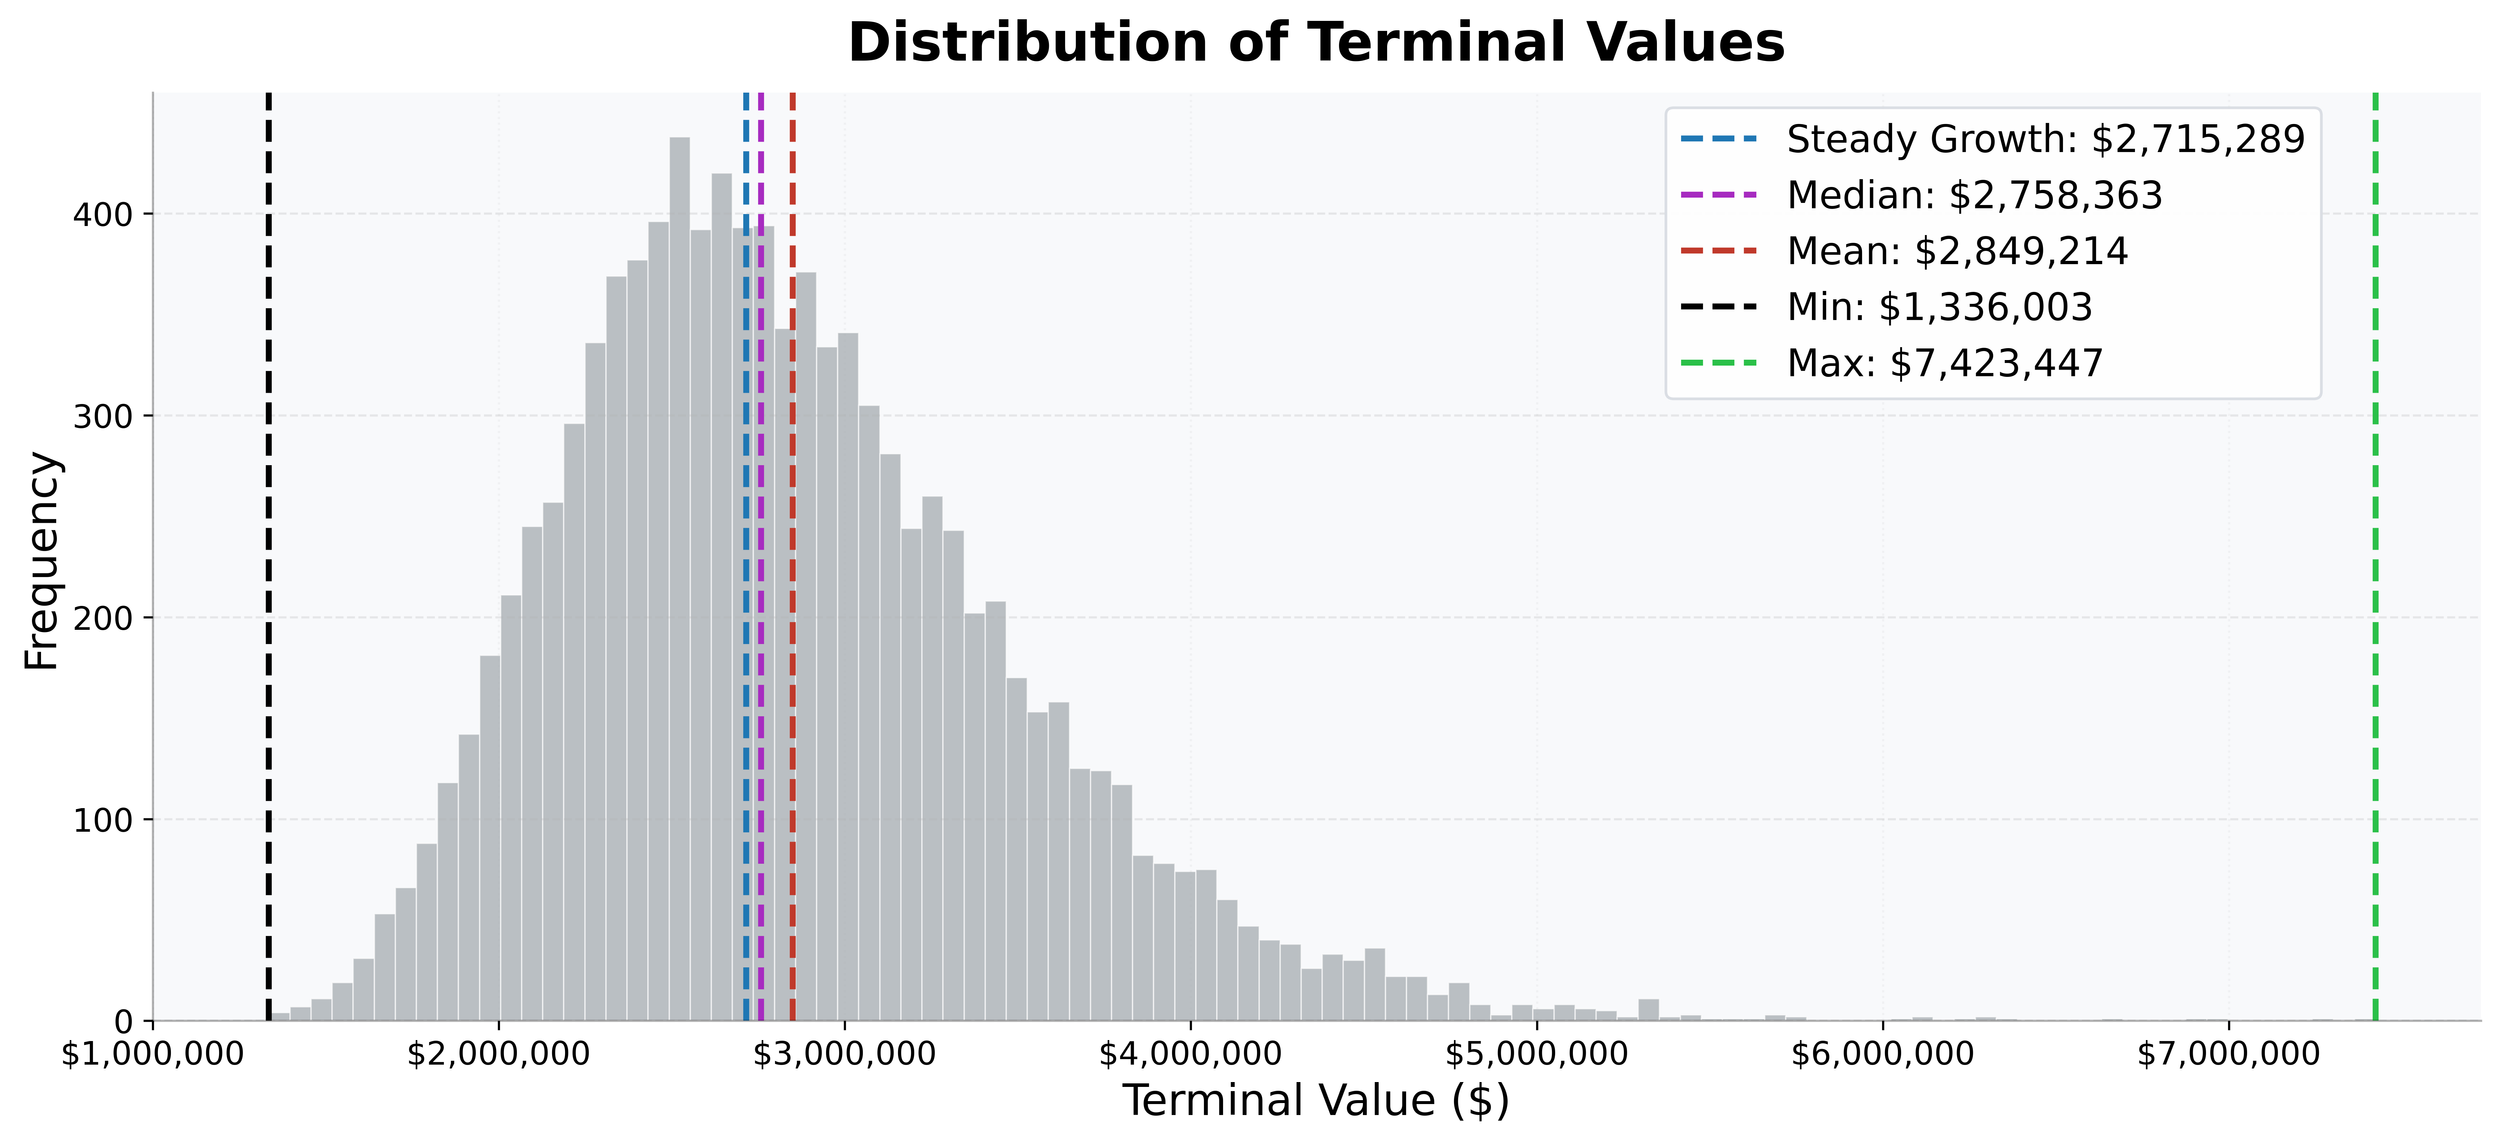
Across all simulations, slightly more than half of the outcomes produced a higher final portfolio value than the steady‑growth scenario. In other words, introducing volatility (while keeping average returns the same) benefited a consistent investor more often than not. The distribution below shows the full range of outcomes.
To better understand what drives superior outcomes in this context, we next examine which types of market paths tend to produce the strongest results for a steady investor. Do better outcomes come from paths that remain above the steady‑growth benchmark, below it, or does the path itself not matter if average returns are the same?
When we group paths by outcome, a pattern emerges. The paths that produce better investor results tend to spend more time below the steady growth benchmark, while underperforming paths tend to spend more time above it. This suggests that lower prices during the contribution phase can improve long-term outcomes.
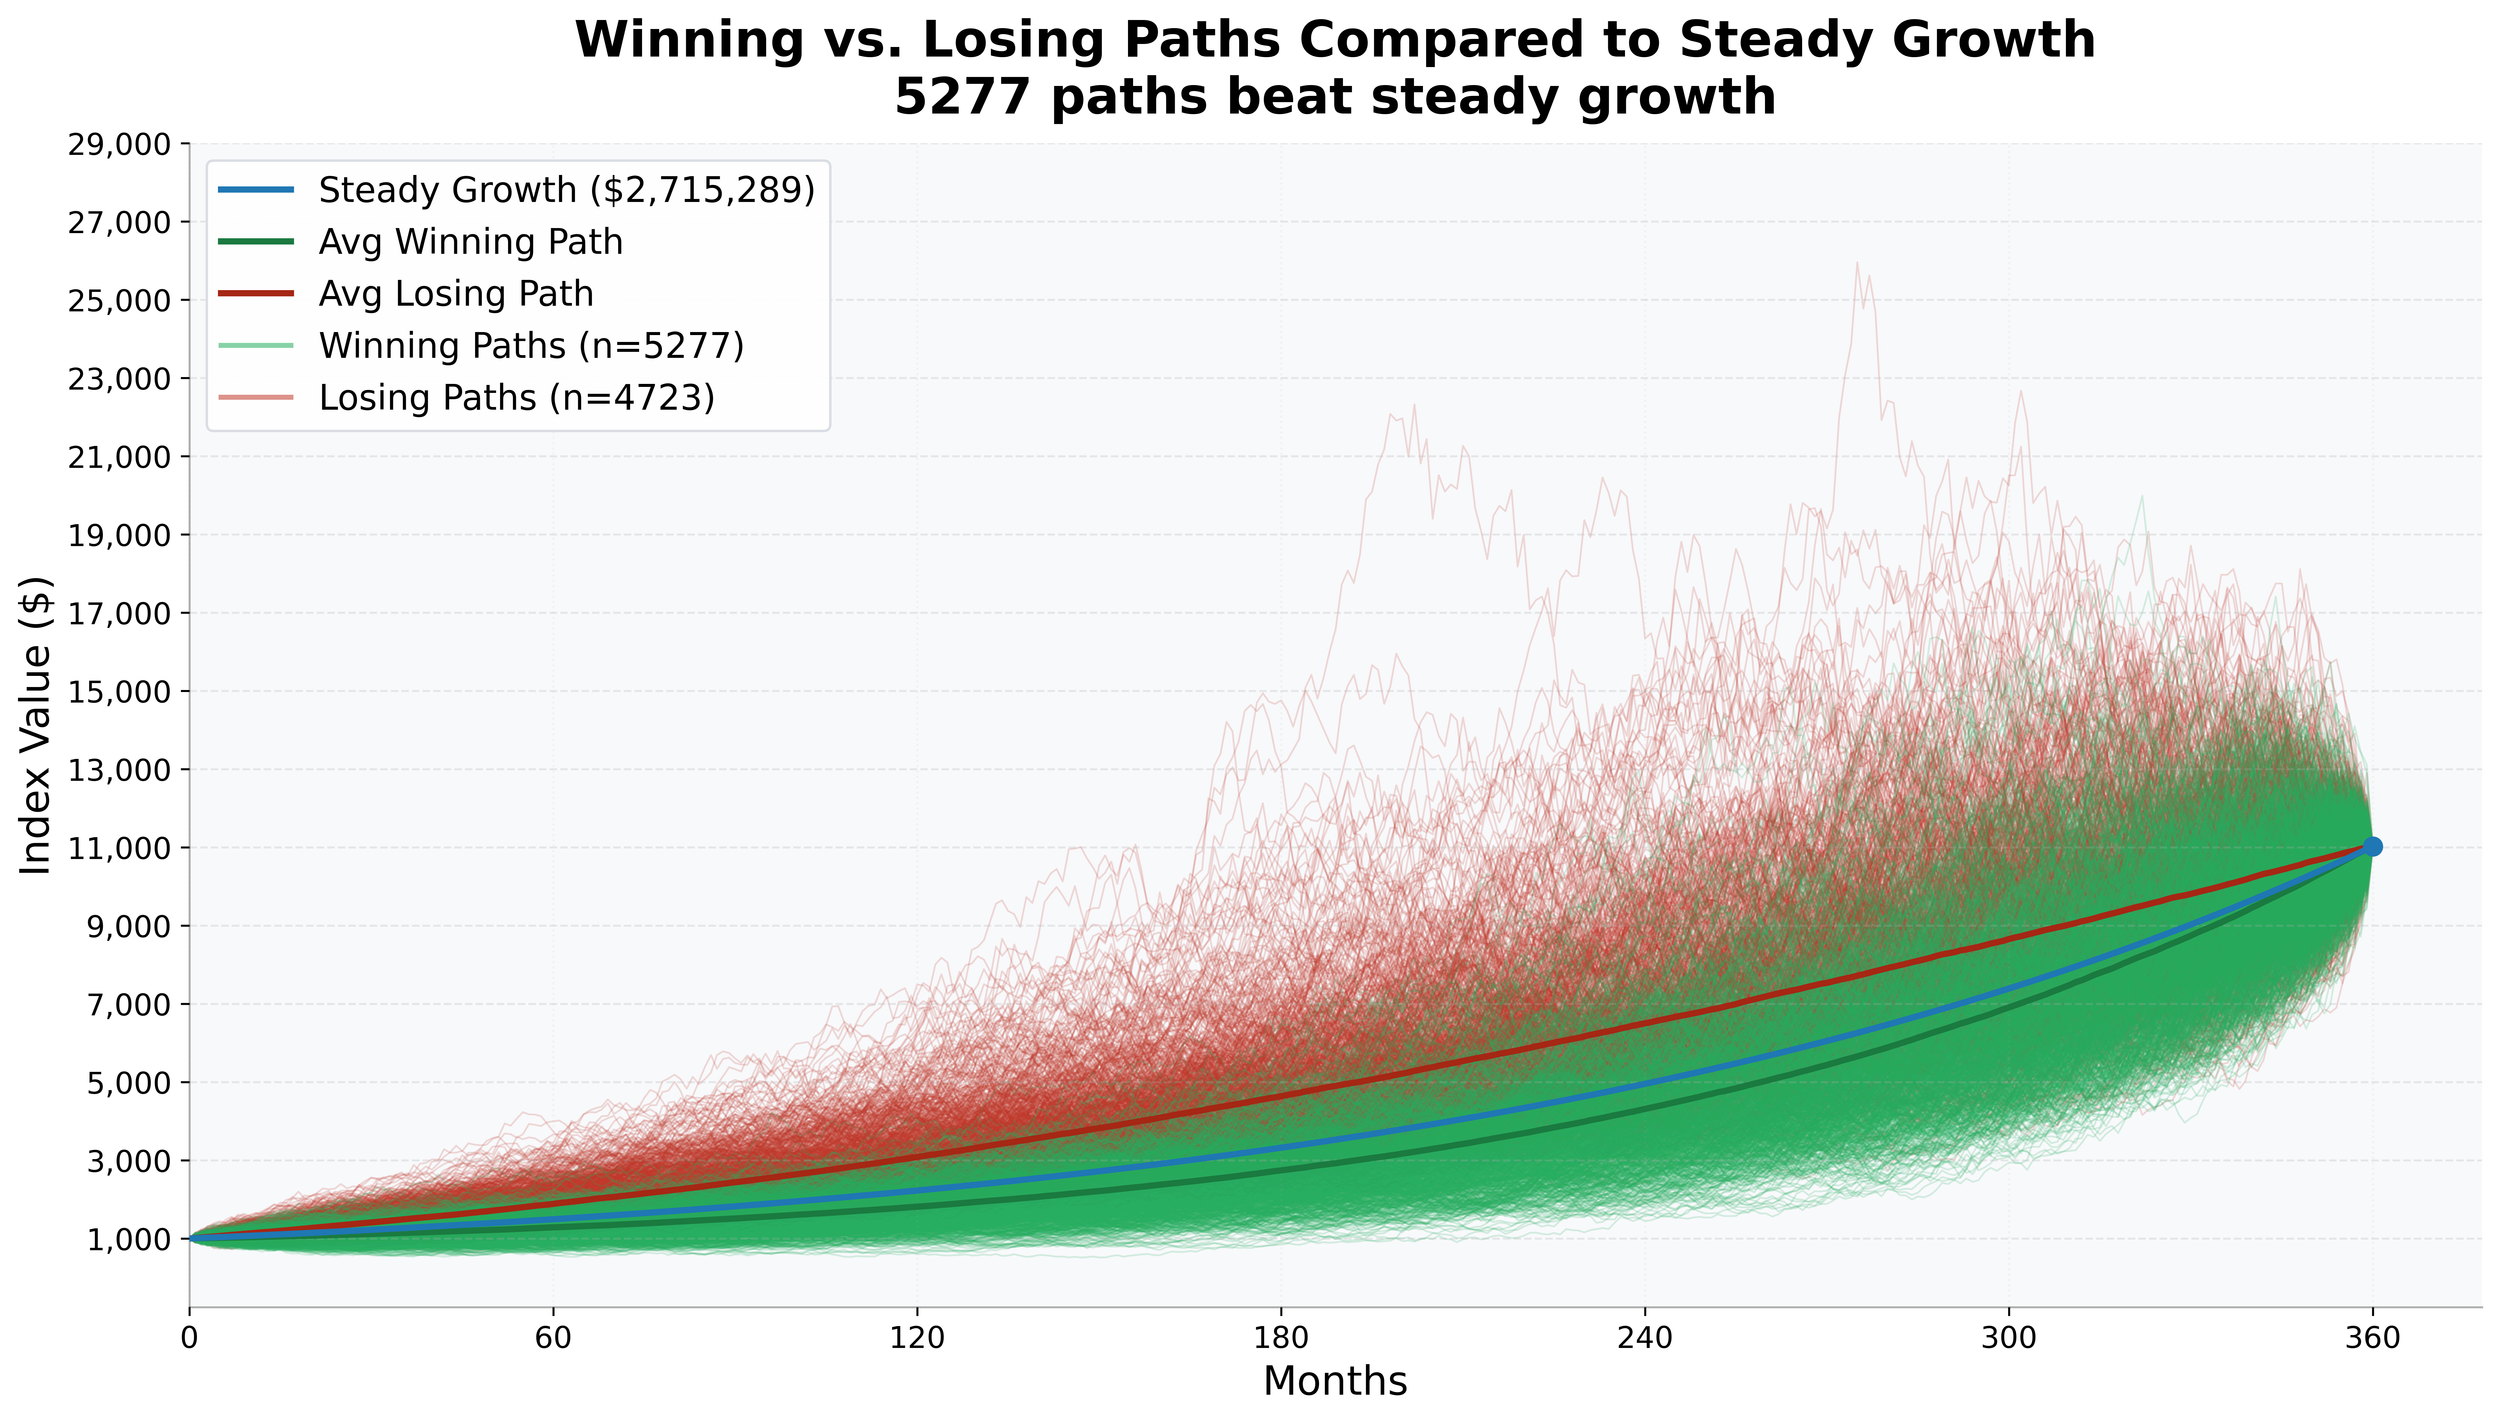
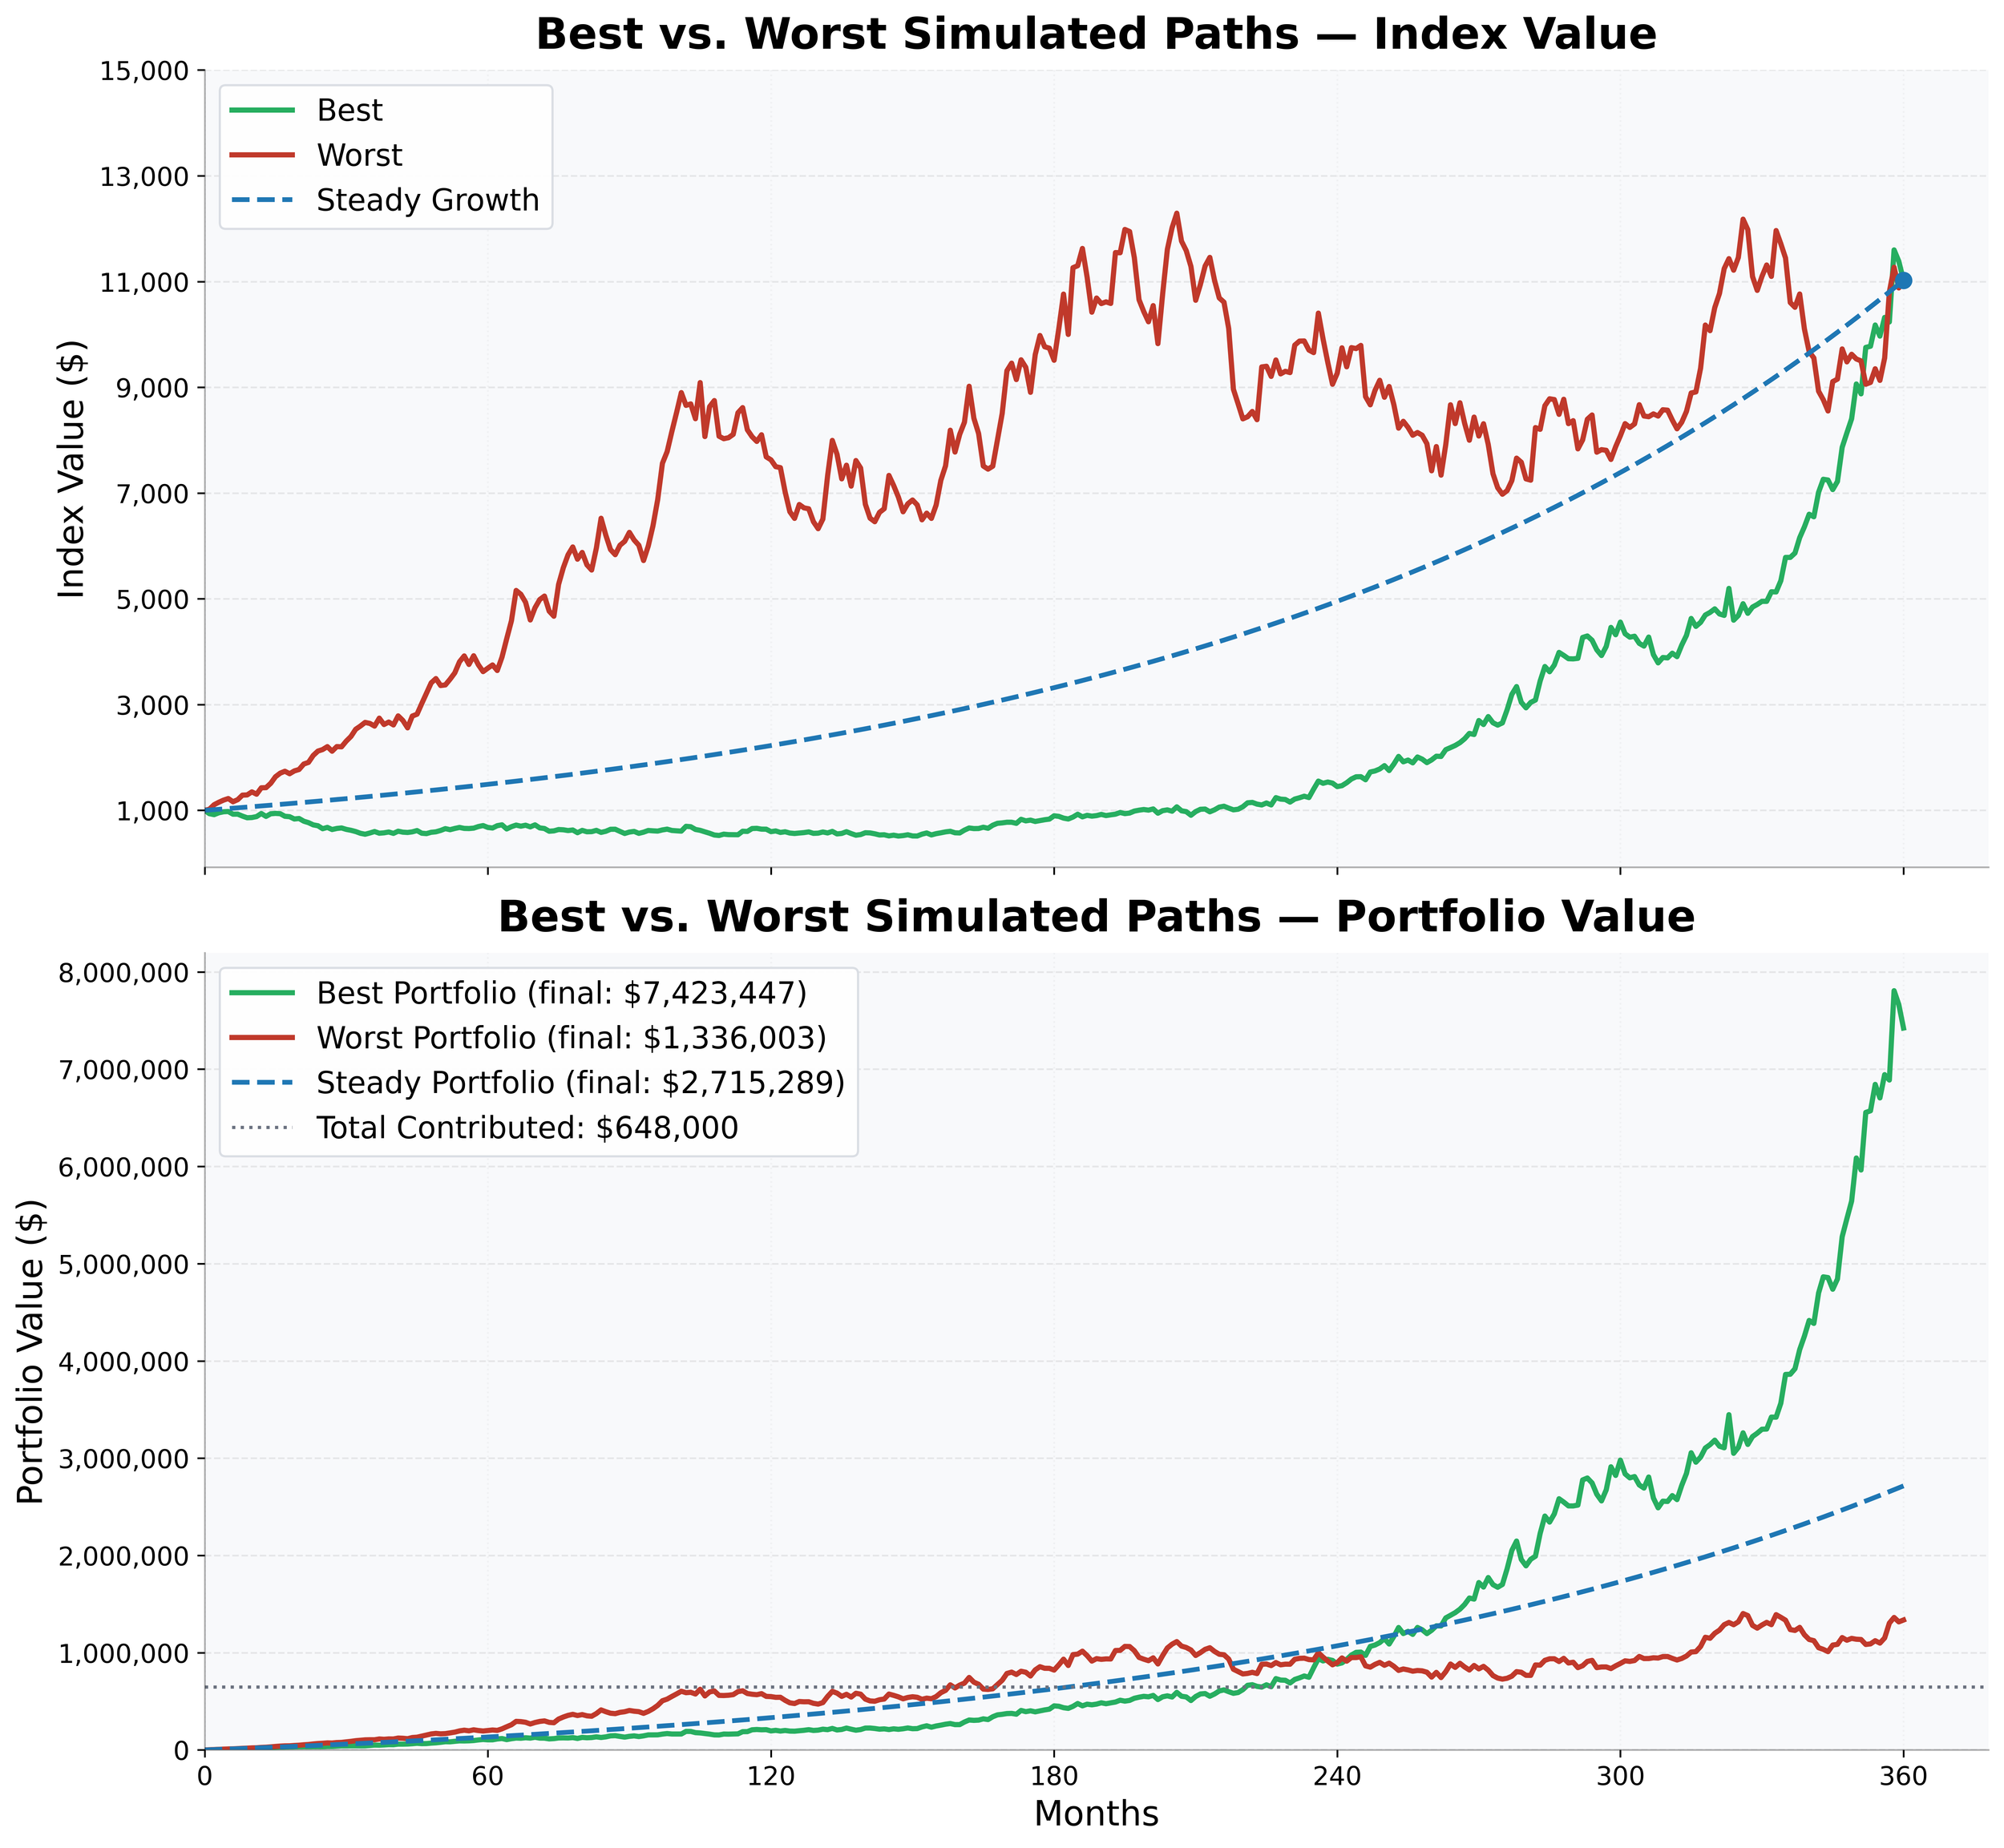
The contrast becomes especially clear when comparing extreme scenarios. The most successful path remains below the steady growth benchmark for most of the investment horizon and rises sharply near the end. The worst performing path follows the opposite pattern, delivering strong early gains before lagging later. This contrast highlights how the sequence of returns (not their long‑term average) has a powerful effect when contributions are made consistently over time.
This analysis is not intended to suggest that market downturns are good, predictable, or psychologically easy to endure. Rather, it serves as a reminder that for investors who contribute consistently to their investments over long periods, market volatility, while uncomfortable, can work in their favor and result in superior outcomes.
Important Disclosures and Limitations
This post is intended for educational purposes only. It relies on simplified assumptions and hypothetical scenarios to build intuition, not to forecast returns or provide investment advice. Real‑world investing involves risks, taxes, personal financial constraints, and emotional factors that no simulation can fully capture.