
Market Cap Vs. GDP?
A common rhetorical device used in popular financial media is the comparison of the market capitalization of companies to the Gross Domestic Product (GDP) of countries.
The following headlines from Forbes, Business Insider, Euronews, and Yahoo Finance are prime examples of the trend:
How valuable is Nvidia? More than 97% of countries' economies-and much more
Apple's market cap is larger than all but 6 of the world's top economies
Nvidia surpasses Germany: How the market caps of tech giants compare to top economies
The comparison is eye-catching: if a company such as Apple or Nvidia has a market value larger than the annual GDP of many nations, it sounds as if the company has somehow become larger than the countries themselves. This can quickly lead a reader to imagine dystopian states of techno-feudalism, or economies made up of mega-monopoly conglomerates with private armies and independently administered land holdings where international law does not apply.
But reality is much less sensational. Market capitalization and GDP are both expressed in dollars, but they are not equivalent measures. Market cap is the market’s current estimate of the value of a company’s equity. It is measured at a point in time and can be roughly calculated as share price multiplied by the current number of shares outstanding. By contrast, GDP measures the value of goods and services produced by a country over one year. In essence, market cap is closer to a price tag for a good, while GDP is closer to the annual dollar value of sales of that good.
This mismatch between a point-in-time value and a rate of accumulation makes the direct comparison logically flawed. Saying that Apple’s market capitalization is larger than the GDP of most major economies is like saying, “My investment portfolio is worth more than my annual salary.” The statement may be numerically true, but it does not mean the portfolio is “larger” than personal income in any meaningful economic sense. It compares a stock of value at one point in time with a flow of income over a period of time.
A more useful comparison would match like with like: either a static value compared to a static value, or a rate compared to a rate. Some examples of useful comparisons would be:
| Type of Measure | Company Measure | Country Measure |
|---|---|---|
| Value | Market Capitalization | National Wealth |
| Value | Enterprise Value | National Wealth + National Debt |
| Annual Rate | Revenue | Gross Output |
| Annual Rate | Value Added | GDP |
| Annual Rate | Earnings | Corporate profits component of GDP |
The problem with each of these comparisons is that, in each case, one side of the comparison is difficult to source. Market cap and enterprise value can be calculated easily for public companies that report on a quarterly basis, whereas national wealth is not a regularly reported measure, subject to many assumptions, and based on unreliable survey results across many international jurisdictions. Similar issues can be raised for the rest of the comparisons listed, which leaves us at an interesting crossroads. Is there actually something useful being communicated by comparing market cap and GDP? After all, both measures are readily available from reliable sources, which cannot be said for many of the more direct methods of comparison.
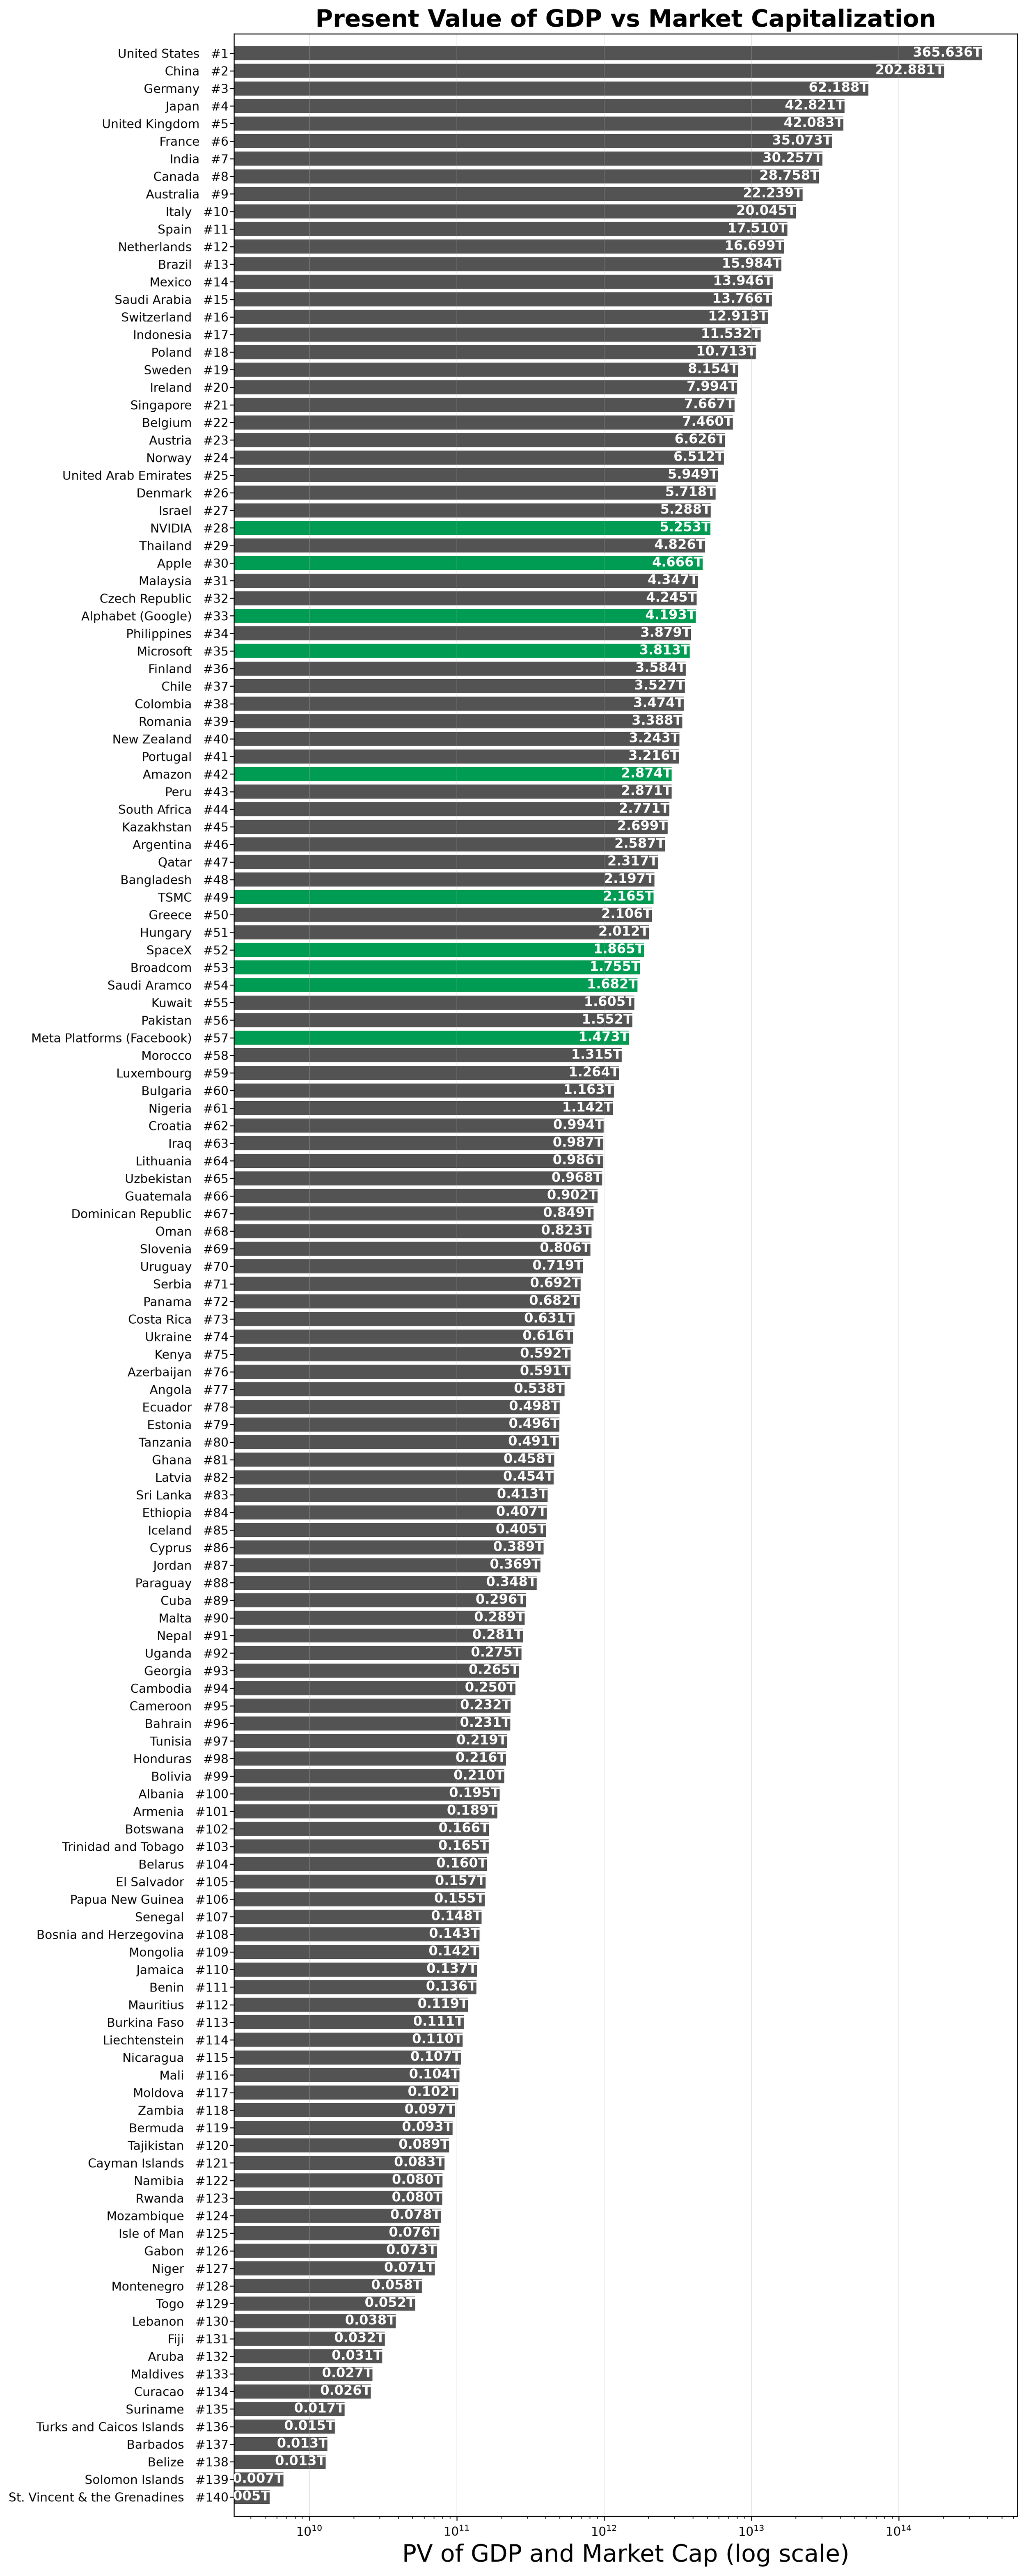
The answer is yes. The headlines do communicate something real: investors are assigning a present value to future company earnings, reflected in market cap, that is in line with the annual economic productivity, or GDP, of some of the largest nations. Even with this charitable framing, the comparison still falls flat. Taking market cap as a present value measure of all future company earnings and comparing it to the economic value created in a country in a single year leaves a big question: what if we found the present value of GDP and compared market cap to that figure?
Although this method is also be subject to assumptions, we can lean on the work of Professor Aswath Damodaran from the Stern School of Business at NYU to address one of the larger issues: estimating the country risk premium. For those interested, the details of the calculation can be found below the table showing the results.
The results are revealing. None of the largest companies crack the top ten economies when we compare market cap to the present value of GDP, but they still rank surprisingly high against some of the world’s most important nations. I will leave the political interpretation of “important” to the reader. The technical takeaway is more straightforward. For Nvidia, currently the largest company by market cap, to enter the top ten it would need to overtake Italy at roughly $20 trillion. That would require almost a 300% increase from its current value. To reach the number three spot ahead of Germany, as one article suggests it already has, Nvidia would need to rise in value by more than 1,100%! The point is not that this is impossible, but that the headline version neglects to mention the true scale of the comparison. These companies are enormous, but when measured against countries on more comparable terms, the world’s largest economies are still very much in the lead.
Calculation Details
The comparison table was built up in a series of steps, starting with country-level risk-premium and GDP data, using that data to calculate a present value of GDP and then supplementing it with market-capitalization figures.
First, the country list in the original country-risk-premium dataset from Professor Damodaran was matched to World Bank country names. Because the labels in the risk-premium file do not always align exactly with World Bank naming conventions, a translation layer was created to map the country names used in the analysis to the corresponding World Bank country codes. The mapping was not 1:1 due to differences in the some naming convention so some of the countries were dropped from the original list. Once this translation table was established, it was used to pull annual GDP data for each country from the World Bank’s World Development Indicators database, specifically the indicator for gross domestic product in current US dollars.
For each country, the most recent GDP level was taken as the starting point and then the expected annual GDP growth rate was estimated using a trailing compound annual growth rate over the prior 10-year period. In formula terms, the calculation is:
The next step was to calculate the present value of GDP. The logic follows a simplified perpetuity-style valuation: the future GDP level is estimated by applying the expected growth rate to the current GDP level, and this is then discounted by the implied cost of equity. In the model, the cost of equity is approximated as:
where the numerator is the projected next-period GDP level. This is a stylized valuation framework, not a full valuation model, and it is intended to translate each country’s economic scale into a comparable, single-number measure for ranking purposes.
The company side of the table was built using market-capitalization data from CompaniesMarketCap.com. The list was filtered to active public companies and ranked by market capitalization, with the values expressed in USD. These company market-cap values were then combined with the country-level present-value-of-GDP values in a single comparison.
Sources used
Country risk premium dataset: https://pages.stern.nyu.edu/~adamodar//New_Home_Page/home.htm
World Bank country metadata: World Bank API, country metadata endpoint (https://api.worldbank.org/v2/country/all?format=json)
GDP series: World Bank World Development Indicators, indicator NY.GDP.MKTP.CD
Company market-cap data: https://companiesmarketcap.com/ website, via HTML table extraction
Disclaimer
This material is provided for informational and educational purposes only and is not intended as, and should not be construed as, investment, legal, tax, or accounting advice. The information is general in nature, does not take into account any individual’s objectives, financial situation, or needs, and should not be relied upon as a recommendation to buy, sell, or hold any security or to engage in any particular investment strategy. Nothing herein constitutes an offer to sell or a solicitation of an offer to buy any security or investment advisory services, nor is it intended to create an advisory relationship. All investing involves risk, including the possible loss of principal. Past performance is not indicative of future results, and no assurance can be given that any strategy will achieve its objectives. Any forward-looking statements, opinions, or estimates are as of the date indicated and may change without notice. Information has been obtained from sources believed to be reliable; however, accuracy and completeness are not guaranteed. If index, benchmark, or third-party information is referenced, it is provided for illustrative purposes only. You should consult with a qualified professional regarding your specific circumstances. Additional information about the adviser, including Form ADV, is available upon request.